
There are several different options for printing the Aged Trial Balance for Receivables Management and Payables Management in Microsoft Dynamics GP.
You can print the Aged Trial Balance for Receivables Management and Payables Management within GP and get the data you are looking for, but you cannot manipulate the data easily. You would have to always change the report options to change how you see the data.
The SQL Reporting Services Reports that Microsoft ships with Microsoft Dynamics GP also have Aged Trial Balances in them. There aren’t as many there, but there are a few. They aren’t the easiest to export to Excel and keep a great format either so you can further “manipulate” the formatting.
- Paybles Aged Trial Balance – by Document Date
-
Payables Aged Trial Balance Details Subreport – by Document Date
- Payables Historical Aged Trial Balance
- Receivables Aged Trial Balance – Detail
- Receivables Historical Aged Trial Balance
There are other options out there as well for purchase, but these are the main two I am aware of that come with Microsoft Dynamics GP.
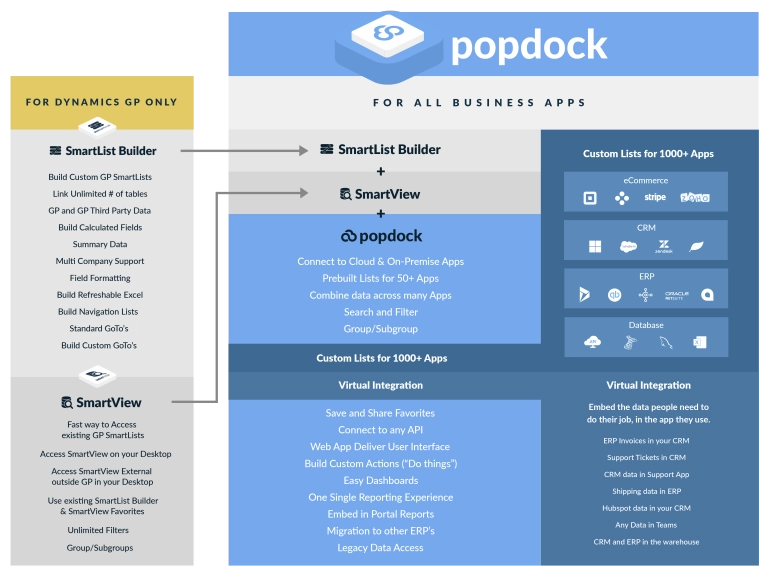
I want to propose a better option: SMARTVIEW
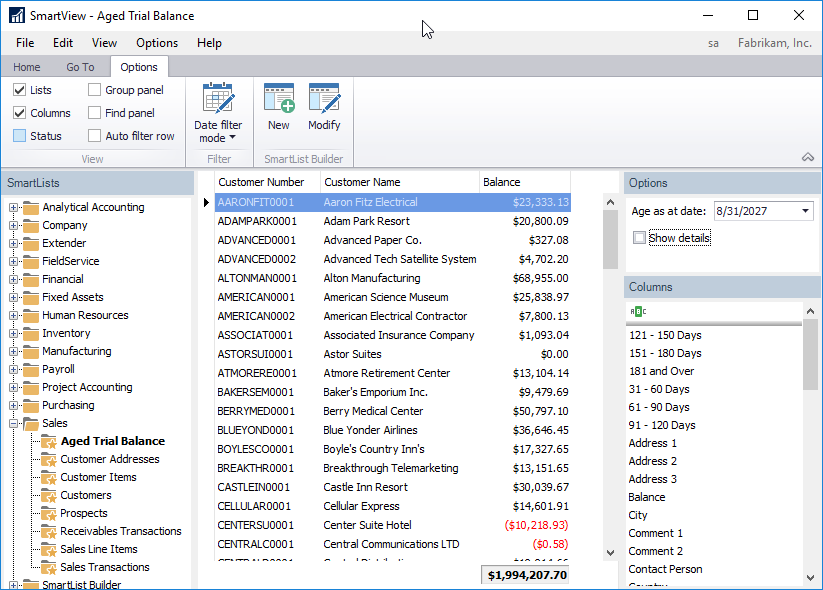
There are many things that make this a much better option, but let me share a few with you.
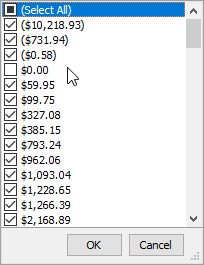
- Easy Filtering: With one check of a box, you can filter out things like $0 balance customers. You can filter on 30 day balances above a certain amount, sales territories, or any other field you are including in your list.
- Change Aging Date: You can easily change the “Age as of Date” to have the list regenerate on the fly.
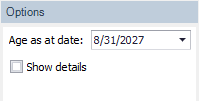
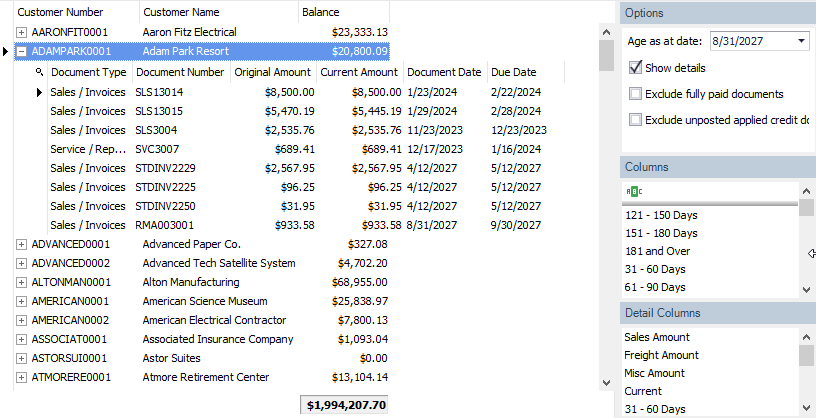
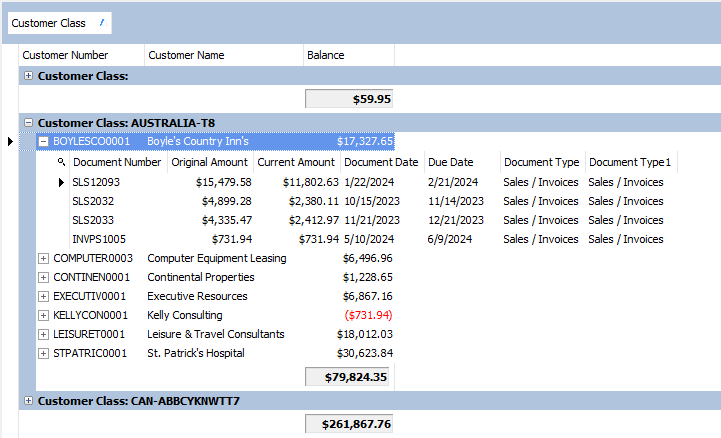
- Show Details: By default the list runs in Summary, but with the check of a button, it will show the details. You can expand each customer to see the detail. You don’t have to see the detail for all customers at once.
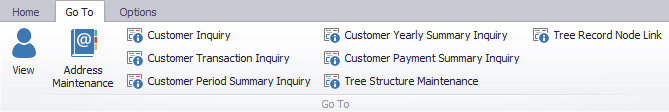
- GoTos: There are many GoTo’s built into the list to drill back the Microsoft Dynamics GP data to view more detail on a specific record.
- Grouping: The data can be grouped by any of the fields in the main list. This means you can group by something like Class ID or Salesperson and then see the data based on this grouping.
- Totaling: Subtotals can be displayed for any column included in the list and will be subtotaled at the group and list level.
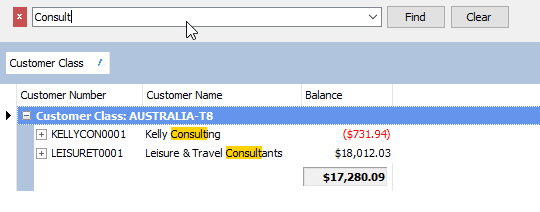
- Find: A find panel is included to allow you to search the data returned in the list for any value.
- Export to Excel: You can export the entire list to Excel, CSV, or PDF. When you export the list, it keeps the grouping, totaling, details, etc that you have expanded/collapsed on the screen. You can also copy specific records to Excel from the list.
Have questions? Let me know! Email me at nicole.albertson@eonesolutions.com.
