If you need to sort and group an excel file after it has been imported as a source your options to sort aren’t as clear as some of the other options. Below are some examples that explore how sorting an excel input works in the SmartConnect connector.
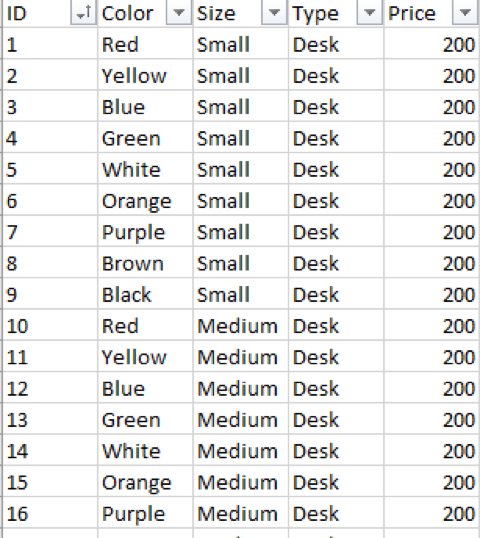
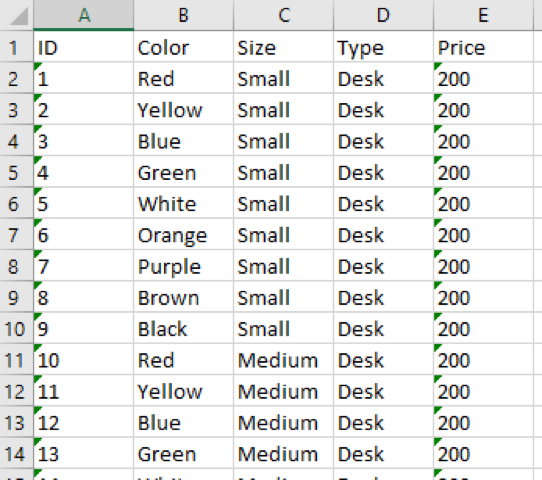
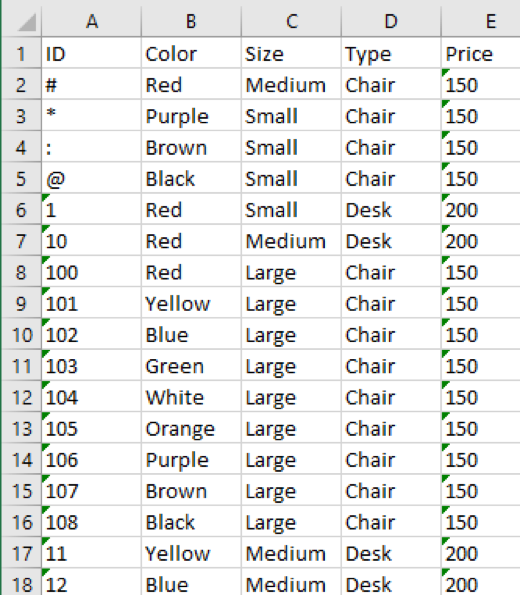
The example file I will use as an input file has 108 rows.
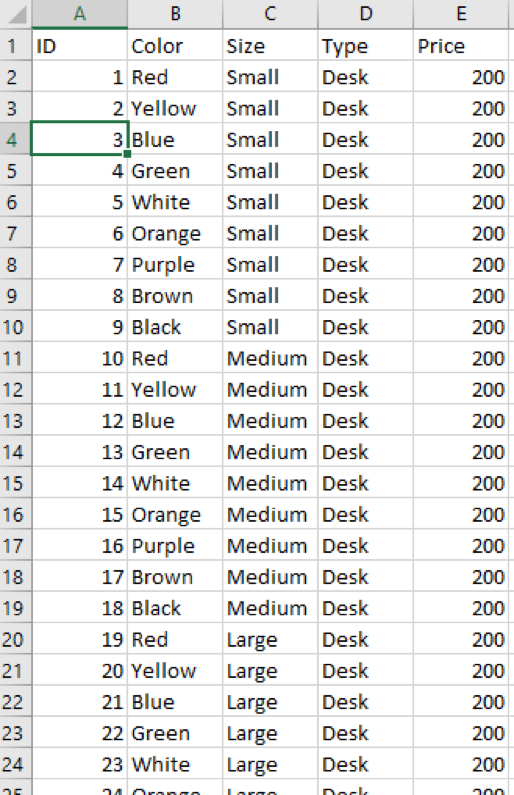
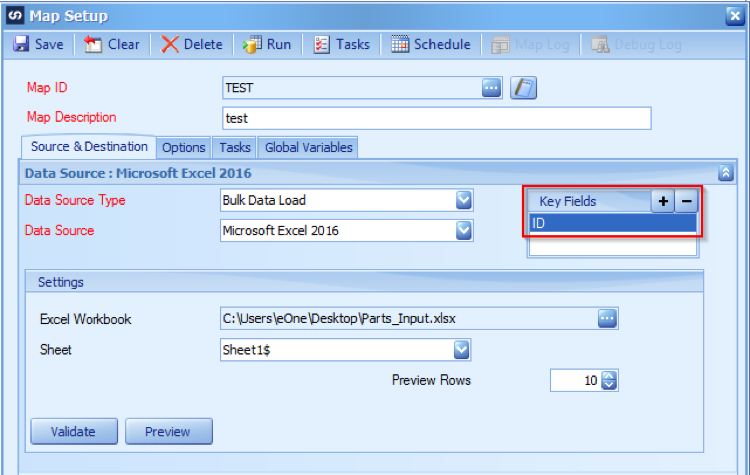
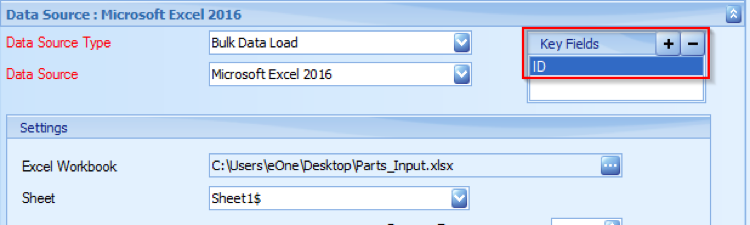
The Key Field is ID and there is no Grouping on the output.
The output file is the same as the input file. Since the Key field is ID, the output is sorted ascending by the ID field.

The ID column in the input excel file was set to Number. If this had been set to text, 10, 11, and 12 would have come after 1 because it would be alphabetic ascending, in that case so 10 comes after 1. Alphabetic sort orders by special characters, numbers, then letters. For grouping and sorting, upper case and lower case letters are counted as the same.
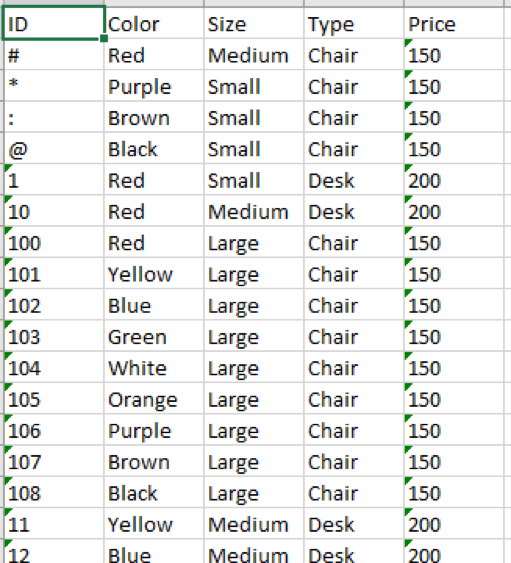
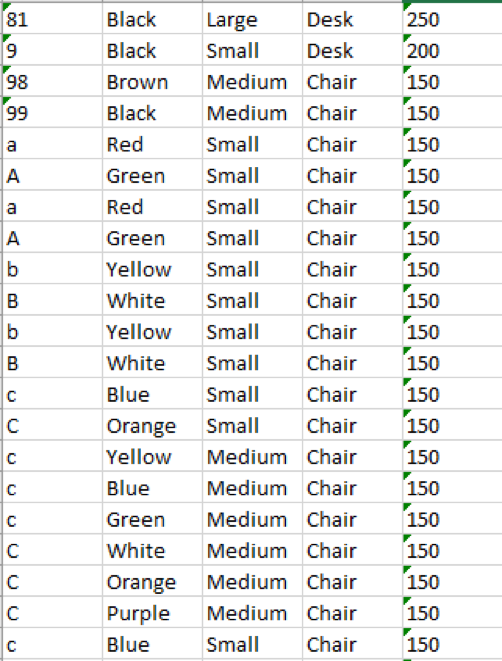
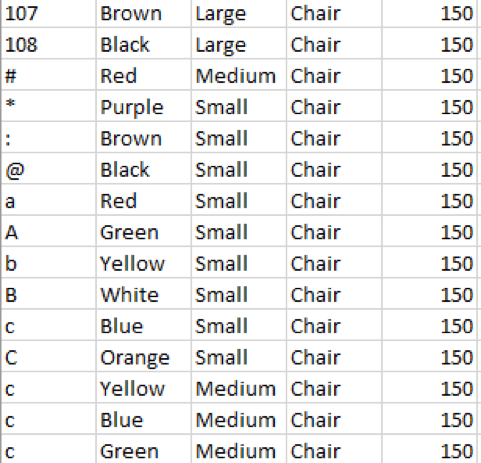
The screenshots below are from an output file where ID column was adjusted in the input file. Special characters and upper and lower-case letters were added and the ID column was switched to text. The special characters where ordered first. Numbers came next, but 10, 100, 101 come after 1 because it is ordering alphabetically. In the second screenshot you see the letters come after the numbers. Where there are letters with both upper-case and lower-case of the same letter, the original order is used because they are treated as the same for sorting and grouping for excel inputs.
Depending on the steps you take in excel, you may see different results. The input is using the same ordering methodology as excel but if you order the column in excel it may show differently. This is because excel can make educated guesses. If you switch the column to number then to text and add letters and special characters as I did in the example below, excel will still recognize the numbers as numbers for sort purposes. It will display the numbers in the correct order this time, then continue with normal alphabetic ordering, special characters then letters.
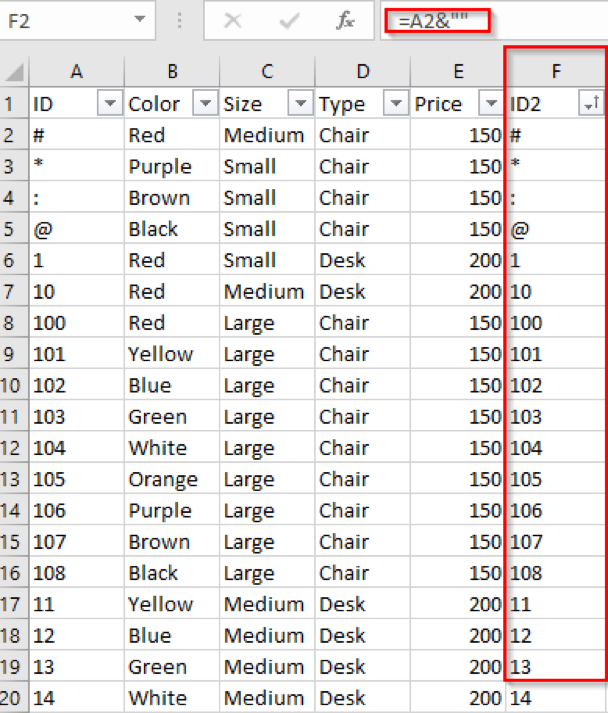
This example below forces the numbers to be read as text by using the formula =A2&””. When this new column is sorted alphabetically, you see the sort matches how the input is sorted in SmartConnect. The input will follow how the field is marked whereas excel may count a number as a number for sorting even when you tell excel it is text.
Let’s run the map with the ID column set to numbers but keep the special characters and letters included. SmartConnect throws the error in the screenshot below. Note the first error was hit on the 93rd line. Looking at line 94 in excel (93 lines + 1 header line), the first error hit was the first non-numerical ID value.
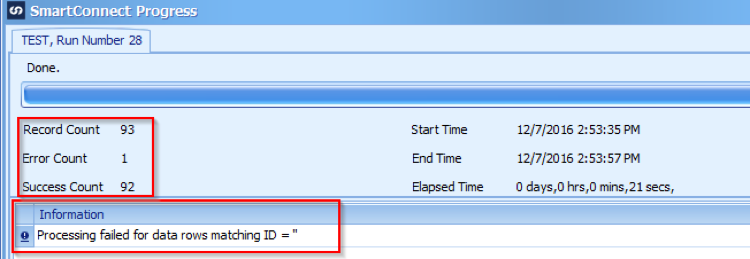
*The record count will show the total number of unique key combinations even if the returned rows are higher where there are duplicates.
First error line hit: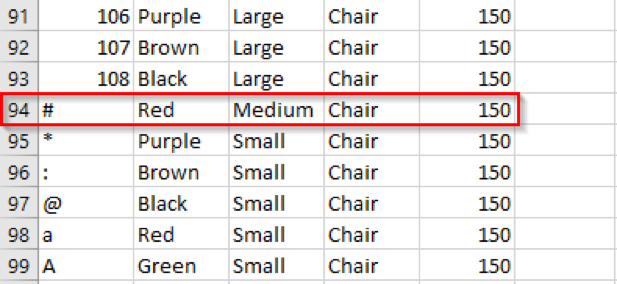
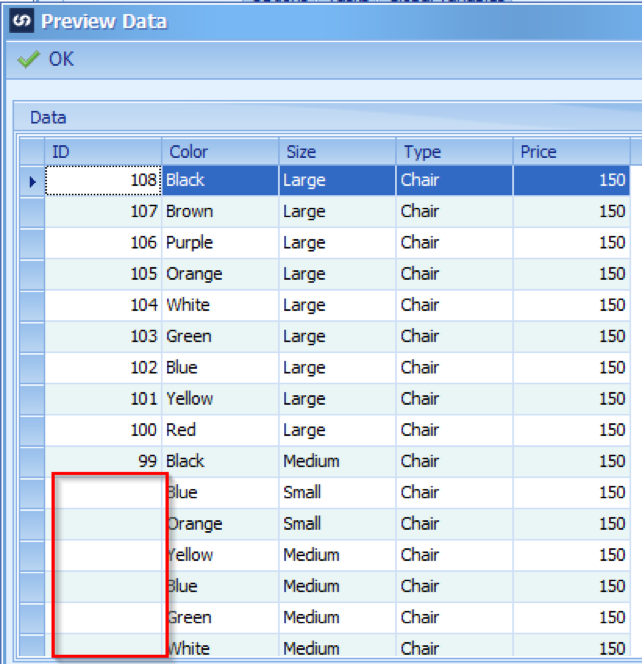
If you pull up the map again and hit the preview button, this error will make more sense. It shows the numerical values in the set but blanks out any non-numerical values as illegal characters. This is why it sees the rows as ID=”. SmartConnect sees these values as blanks when the map is run.
Now sort the ID column descending in your input file and rerun the map. This time SmartConnect does not give you an error. Why is this? When the input file is pulled in, the first 8 rows are previewed. SmartConnect sees the first 8 rows include non-numerical values and assumes the field is a string instead of a number.

This time we will put the alphabetical and special characters starting at row 11.
SmartConnect counts the ID column as numerical this time and counts and alphabetical and special characters as errors and removes them from the input set (92 rows instead of 108 and only includes numbers). This is because SmartConnect encounters the number values first set as numerical and uses this to determine the field values.
One last set of examples. Let’s set the ID field to general and try running the map.
This time SmartConnect decides the field is a string and pulls in all values without error and sorts alphabetically.
This time convert the top 10 rows to numbers and keep the cell type as general.
Only the top 10 rows return. The rest of the rows excel counted as numbers stored as text and did not include them in the result set.
Even though excel may say a column is text, general, or number, the actual value may be different. If you run into this issue, you can force a number to text by adding a second ID column and using the formula referring to the first column as =A2&””. You can do the same to force a number by using the formula =A2+0, note however that this will cause errors on anything with a non-numerical character, including spaces. Using the trim() function will help to get rid of any leading or trailing spaces to make sure your field pulls in and sorts as intended.
Sorting and Grouping your Source Excel File in SmartConnect
Now let’s look at how sorting and grouping works in SmartConnect once the excel file is pulled in as a source.
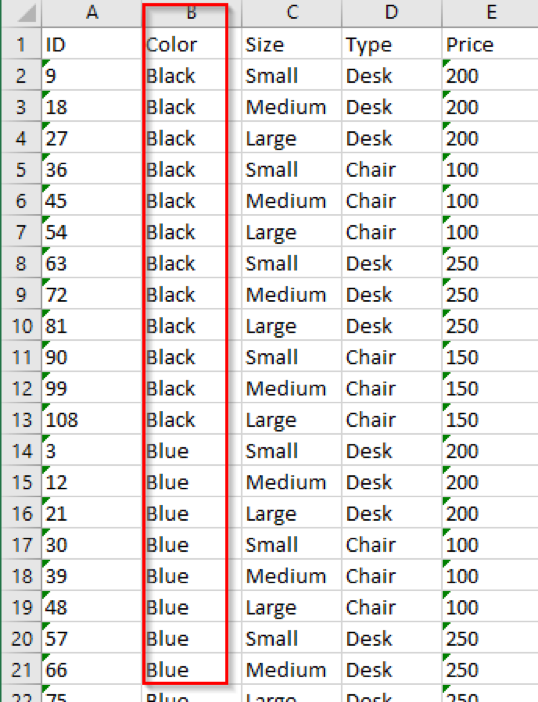
The original input file has 108 rows. The Key Field in this example is set to ID. This field is completely unique and is all numbers. The example returns as sorted numerically ascending.

*Because the ID field is completely unique values, adding any additional key fields would not have any effect.
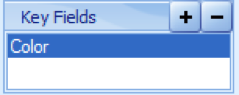
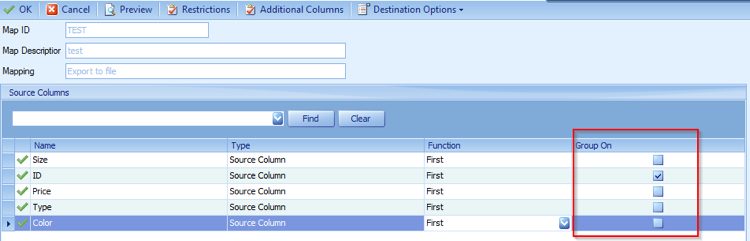
Setting the Color Field as the Key Field sorts the color field alphabetically ascending.
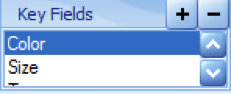
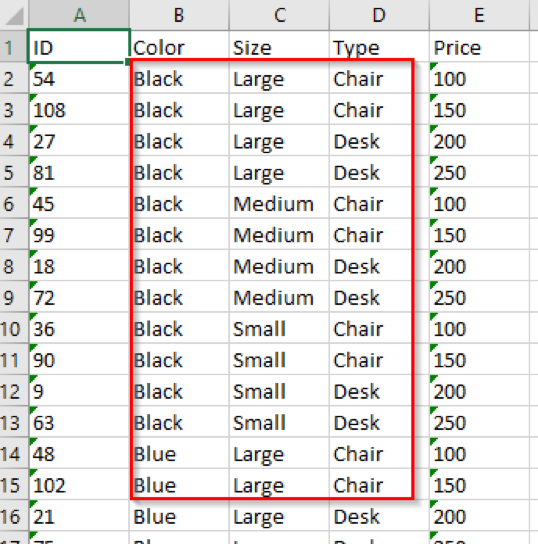
Setting the Key Fields as Color, Size, Type sets the sort to Color alphabetical ascending then Size then Type.
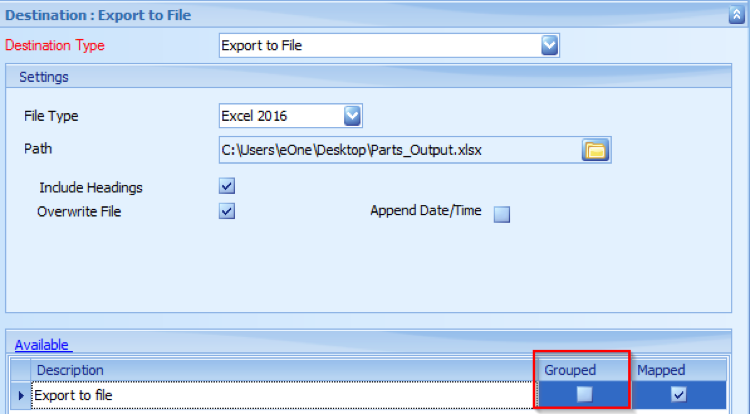
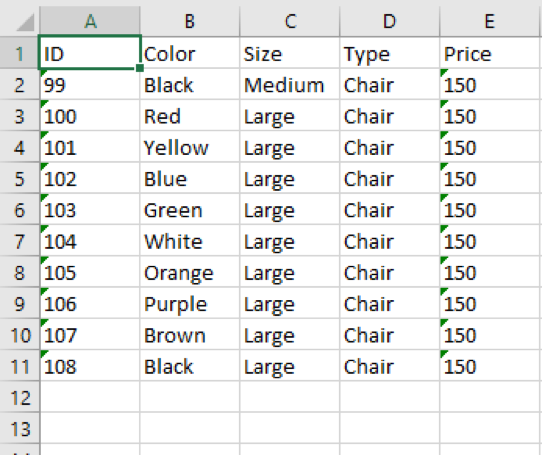
Going into the destination, then clicking into the entity you want map, click the group by button at the top. Then run the map.
The output file now has 54 rows. It automatically groups by all the key fields.
Grouping by any other column other than the key fields in the mapping window will add that field to the grouping and will be added as a sort after the key field sorts. The number of rows returned will increase because the additional grouped column is added onto the unique key for sorting and grouping purposes.
One other option is to use the ODBC connector instead to import your excel file.
Click the Modify Button.
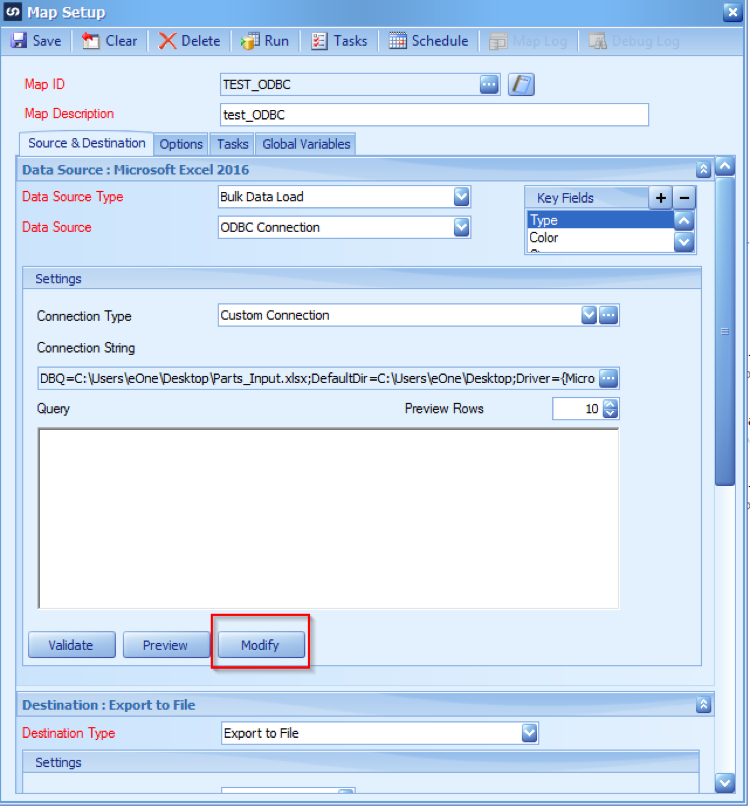
You are able to treat your excel file like a query. At the bottom you are able to select the field(s) you would like to sort on and have greater control and options on the sort.

If you have any questions on sorting and grouping, please feel free to as ask in the comments below.
Thanks!