You may have read Naomi Olson’s blog on a new list she has in SmartView for tracking the teams sales goals. If you haven’t, you can take a peek here.
I wanted to give you a little more detail on how we accomplished making this list.
I will start out with the background on why we are tracking this in GP. When talking to a member of the sales team, I watched them running the Sales Line Items SmartList with a filter on it for the month. They were grouping it by the item and then proceeding to take the total for that item and typing it into an Excel spreadsheet they used to track their sales goals. I couldn’t believe we were tracking this manually in Excel when the data was all in GP to grab automatically to compare, so I set out to make life easier for them.
First, I had to create a place in GP to track the sales goals. What better way to do this than with an Extender Form. I created a basic form as you can see below to track the yearly budget for each product that they needed to track. They track a Base, Goal, and Stretch goal.

After getting that data entered, I needed to figure out how I was going to bring the data into SmartList Builder. I knew I had to first get the quantity we had sold of each product from sales, so I started by bringing the Sales Line Items in using the SmartList table type. I then linked on my Extender form that I had created. I only wanted the items on my list that had goals, so I did an equals join between the two. I now had a list of each sale that was made for each product so I used the summary option to make it summarize by the item. I found that this was too much, so I created calculations so that I could also summarize by the month and year from the docdate. They looked something like this: MONTH ( {Sales Line Items:Document Date} ) and YEAR ( {Sales Line Items:Document Date} ).
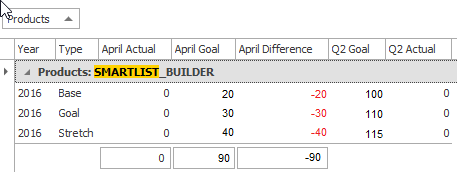
This technically got me there, but I had a line for each month and I wanted it going across the list so that I had the item 3 times, one for each type of goal and then a column for each months actual and goal.
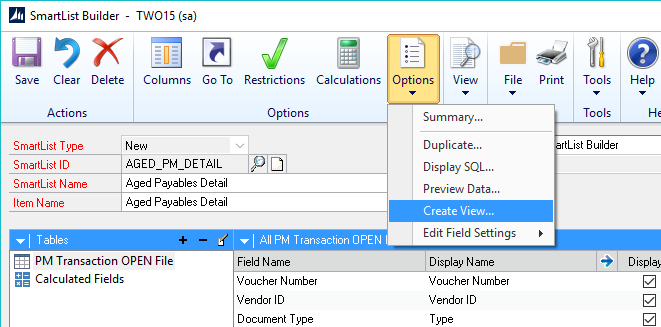
To do this, I found that the summary options weren’t going to quite work for me in SmartList Builder because I needed to summarize the data once for just the sales invoices/returns and then I needed to do it again for each month on my list. So, I went to my SLB setup and took the SQL Script I had in it (Options – Display SQL) and set about modifying it in SQL.
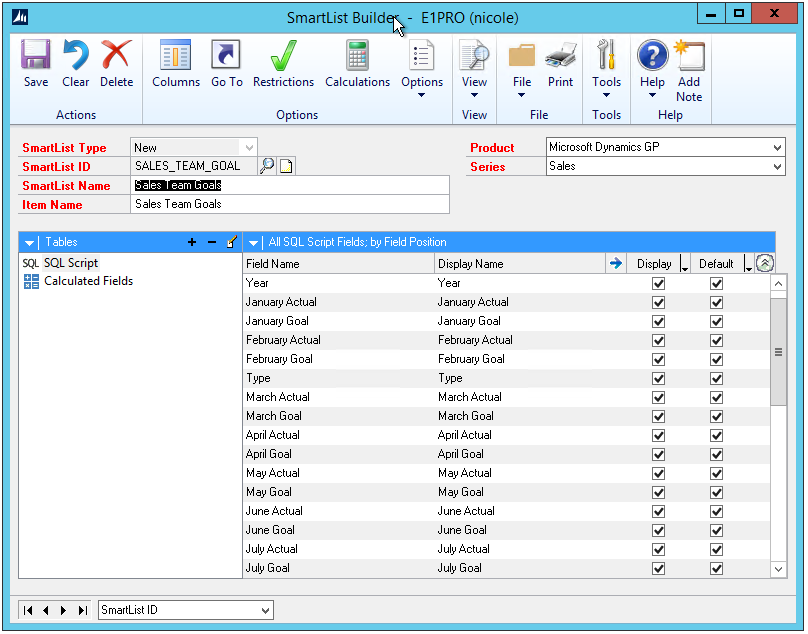
I had to modify the script in SQL so that it did the calculations, grouping, etc that I wanted. Once I got that working so that I had a line for each product that was similar to what I had before in SmartList Builder, I removed the setup I already had in SLB and added a SQL Script table with this script in it. This then allowed me to summarize the whole list by the product, year, and month to get the data that I expected. I then created more calculations in SmartList Builder to calculate the difference between the actual quantity and goal for each month as well as quarterly totals. Happy with it I turned it over to the team to use and they were enjoying having it.
Recently I found that it wasn’t truly doing what I wanted it to. It wasn’t displaying all of the items that had goals. It would only show the ones that actually had an invoice for them. It also wasn’t showing the goals for future months. It was only showing them once there was an invoice for them. So, again I found myself trying to sort through my SQL Script. What I had done is put the Sales Line Items as my first table, so if I didn’t have an invoice, I didn’t get any data for that item. I ended up reversing the setup and using my Extender form as the first table because I wanted the information for all of the goals I had set. This worked great.
So, what did I learn from all of this?
- Patience is a virtue as this one took some time and thought to create.
- While you might not be able to get it to look exactly like you want in SmartList Builder because of issues like needed to double group and such, you can use SmartList Builder to build the basic query and then take that query to SQL and modify it and bring it back to SmartList Builder.
- It is best to do it in small sections. I started small, but then got too optimistic and had started creating all my fields and calculations and such only to find that I wasn’t pulling the original data quite right so I had to modify all of them instead of just testing with one first.
- Make sure that you have the end users test it before they really get to using it. I found they were using the totals on the report for all products together and because some products weren’t showing, the total for the goals were not correct, so it reported the incorrect goals.