SmartConnect 2018
Viewing Debug Logs
There are three ways to view map debug logs:
| • | Select the Debug Log button from the map processing screen. |
| • | Selecting Logs >> Map Logs. |
| • | Selecting Debug Log on the map setup screen. |
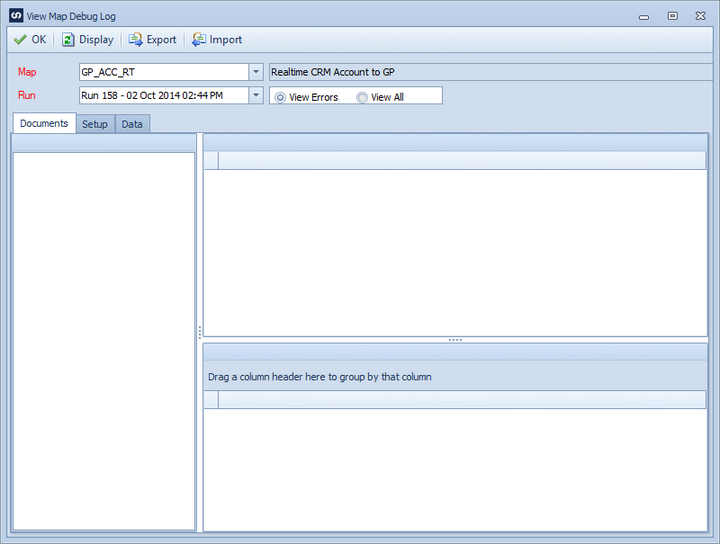
Upon opening the viewing area the user is prompted for the ID of the map to be viewed, as well as the map run number. (This may be defaulted depending on how the user accesses the screen) By default only errors are displayed, however all log entries may be viewed by selecting the View All radio button.

Select Redisplay to display the requested log entries. Each time the display selections are changed the Redisplay button should be selected to update the information display.
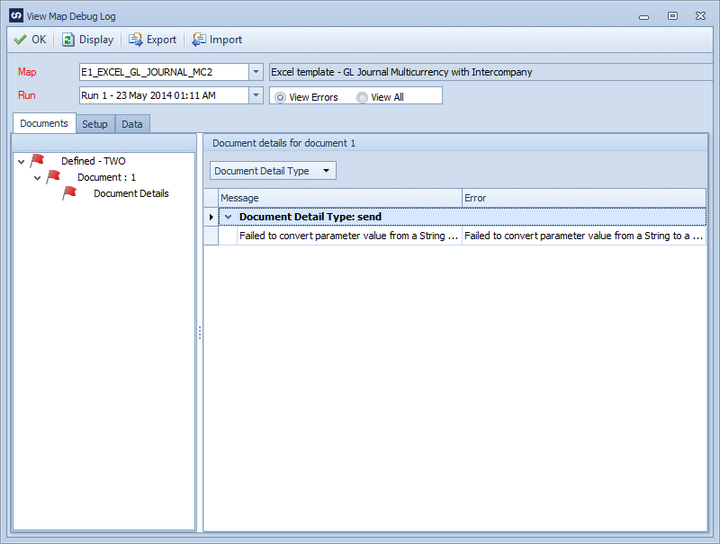
Log entries that were triggered by a successful process, or were the parent of only successful processes are displayed with a green flag. Entries that were triggered by, or were parent to a failed process are displayed with a red flag.
Log information is divided into tabs on the view log screen. The tabs and information they contain are defined as follows:
Documents
All information pertaining to document processing is displayed on this tab. Each document is displayed in the order in which it was processed, and divided into the following areas:
| • | Document Details - contains a base overview of the document processing. |
| • | Document Tasks - contains any document tasks that were run for each document. |
| • | Destination Mapping Processing - contains each object that was mapped to the map destination, as well as the processing details for that mapping. |
| • | Source data used for the mapping of each document may be viewed, and the mapping details filtered by detail type. |

Setup
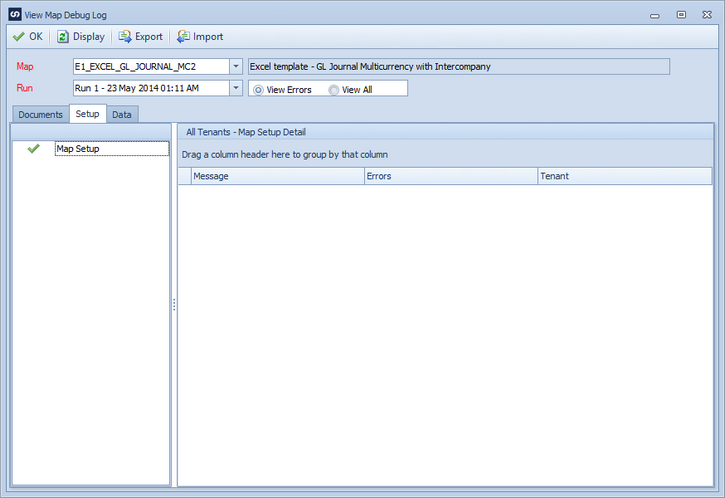
The setup tab contains information pertaining to the setup, validation and master processing of the map. This area contains information on the data source type, connection success or failure, grouping and filtering of source data as well as destination setup. Where applicable setup information is displayed within the destination / tenant to which it was processed.

Data
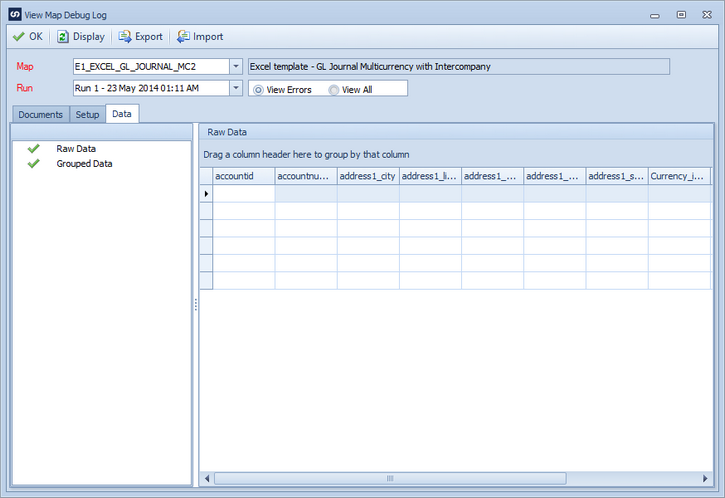
The data tab contains raw source data, and grouped source data. The raw source data is the data obtained from the data source when the map was processed. One of the first steps in map processing is to group the data according to key fields. This grouped data is then stored and shown in the grouped data view.
