“You should always pick the right tool for what you’re doing” seems like a really trite way to open this post.
But I just did. Hopefully it brings you in anyway.
One of the biggest problems I have in picking tools is identifying exactly what it is I’m trying to do. For example, it isn’t enough that I want to cut that piece of wood. How pretty does the cut need to be? If it’s a rough cut I can likely use a circular saw. To get a nice curve I’ll need a jigsaw instead. Sometime, over drinks at a conference, ask me what happened when I used a circular saw to trim the bottom of my mother-in-law’s bathroom door.
When it comes to business reporting, the same concept applies! You need to make sure you’re choosing a purpose built tool!
So, what is the equivalent to “type of cut” when it comes to business reporting? In general, based on my experience, there are three basic types of business report which I classify as Financial, Management, and Operational.
Financial Reports
Basically, Financial Reports are where Accountants live their day to day.
In my experience, financial reports are really meant for the board, the bank, and the government. While the format might be marginally different for each of those audiences, the same key factors apply:
- There is a set list of reports that are standard (Balance sheet, P&L, Cash Flow)
- Each report has a set of rules to follow defined by local GAAP requirements, Regulatory requirements, and/or industrial standards
- The reports are based primarily on the General Ledger
- The reports are based on a specific accounting period
There are a lot of financial reporting tools out there. Some of the ones I have experienced are FRx, Management Reporter, Jet Financials, TM1, and Hyperion.
Management Reports
If I had to invent a definition for the phrase “management report”, I’d say that it is any aggregate report that a process owner uses to base business decisions on.
One key here is that the audience defines the requirements for the report, regardless of the purpose. While regulatory, industrial, or legal requirements might impact the report requirements to some degree, the ultimate design and purpose of the report comes from the report consumer.
Normally these reports are based on all relevant data, not just (and sometimes not including) the financial data contained in the General Ledger. In fact, I have met relevant and correct management reports that didn’t tie to the financial results at all.
Basically, the reports in this category tend to be at the “10,000 to 30,000” foot level. We are looking at aggregated data in an attempt to analyze measurable performance indicators and either assess past performance or infer future performance.
From a tools perspective, this space is huge. Like I said, the audience defines the requirements per report so you might find your company is using more than 1 tool in fulfilling your management reporting requirements. The next time you wander around a financial system conference expo hall, look for any booth that is promoting their BI tool. They sell management reports.
Operational Reports
Like management reports, operational reports include all of the business data – not just (and often not including) the general ledger – and requirements are driven by the specific report audience or purpose.
Unlike management reports, operational reports are much more “in the weeds”. Even “summarized” operational reports are more focused on the day to day than Management reports tend to be. For example, an operational report might be “current open orders” while a management equivalent would be “Month to Date Sales”.
Essentially, operational reports are meant for the process participants whereas Management reports are meant for the process owners. As an example, a collections clerk wants to see all of the past due invoices as of “right now”, regardless of what the Balance Sheet is reporting. That clerk needs to call everyone on that list to find out when we are going to get paid. An AR manager, though, wants to see a summarized Aged accounts Receivable report, which should tie to the AR Balance reported on the Balance Sheet. They likely want to compare to the aged receivables from past financial periods to see how our collections processes are doing overall.
In my experience, the lion’s share of operational reports are presented in tabular form (with occasional visualizations as appropriate) – making Excel a perfect tool. However, this space is huge in respect to tools as well. Depending on your audience you might see tools like SmartList, Report Writer, SSRS, or Crystal Reports. Many of the off the shelf BI Solutions can be used to generate operational reporting as well.
Blurry Lines
In preparation for this series, I reached out to a few other MVP’s. While I can picture the 3 categories above in my head as having clear lines between them, a couple of them were able to blur things a bit.
For example, both Belinda Allen and Jen Kuntz pointed out that often times a pared down version of the financials is included in a management reporting package. This tends to be in companies where that manager has some fiduciary responsibility.
Shawn Dorward took that a little further. He said that a version of some Operational Reports and Management Reports are used to help prove out the financial reports. For example, point in time agings of Accounts Payable and Accounts Receivable.
My personal opinion here is that the individual report purposes don’t change from the categories above. However, in many cases the categories need to be mixed in order to come up with a comprehensive reporting package. Peanut butter on toast isn’t complete until you add the bananas, right?
Where does Popdock fit in?
Popdock is primarily an Operational reporting tool.
Using PopDock, users can query data from any data source. This includes not only the General Ledger, Subledger, and CRM data contained in traditional reports but also any other relevant solution – cloud based or on premise. Where there is a link between 2 disparate systems, users are able to join the data from those systems for a more comprehensive report – all without writing any code.
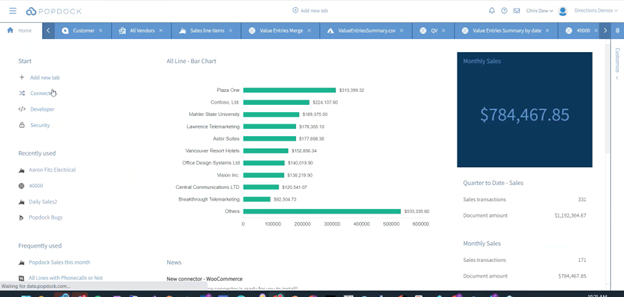
Data is presented to the users in tabular form primarily, but there is an option to include visualizations where appropriate. More on that in a later post.
Basically, if the data exists and a user wants to query it to help them through their daily processes – Popdock is the right tool.
You can read part one of this series, “Picking the Right Tool“ here.