

Building my first Matrix Report – Step by Step
“Eat your own dog food” is not my favorite saying, but it is something that eOne takes seriously.
We use every eOne product in-house to run our business. We automate and integrate everything with SmartConnect. We store a bunch of partner margins and product details in Extender. We have built hundreds of Smartlist Builder reports, and we expose all those reports to the whole team through Popdock.
So, when we recently released a new feature for Popdock, Matrix Reports, I decided that I had to give it a go. Our marketing team says, “Matrix Reporting was designed for end users to build their own management reports,” and I wanted to see if that was true.
If I can build a report, then anyone can build a report.
What I Wanted:
I wanted to build a report that would allow me to compare month-to-date sales numbers with the same month-to-date period of last year. For example, if it’s June 15, 2023, I want to compare the sales number from this period (June 1 – June 15, 2023) with sales over the same period in the previous year (June 1 – June 15, 2022). I later realized how easy it was to include year-to-date sales numbers, so I added that to the report as well.
The final version of my report looked like this:
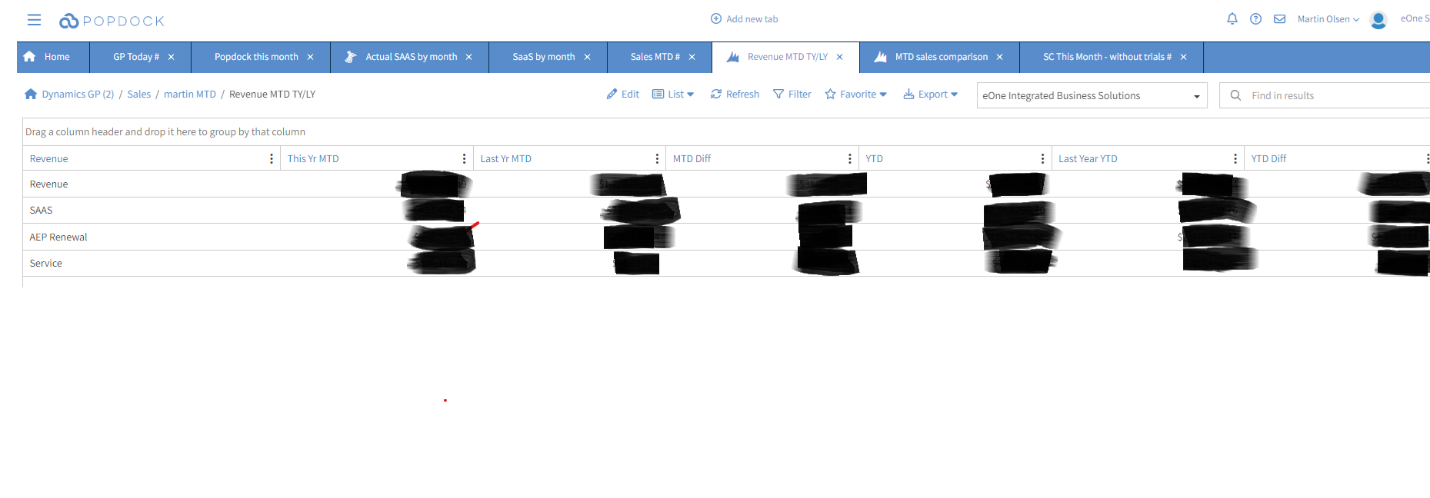
But trust me when I tell you, the first version did not. Apologies for blacking out the fields, but it’s probably not a great idea to share eOne’s revenue report with the world!
What I Did and What I Learned:
When I build any sort of report, I always start simple. The first step is to ‘return some data’ and I build out the complexities of the report from there. If you start by building a report with all sorts of restrictions and every data field up front, it’s impossible to know where to start trouble shooting if the report doesn’t return the data you want. Start simple.
Matrix reports are custom reports inside of Popdock. To start building, select the menu icon in the upper left-hand corner.

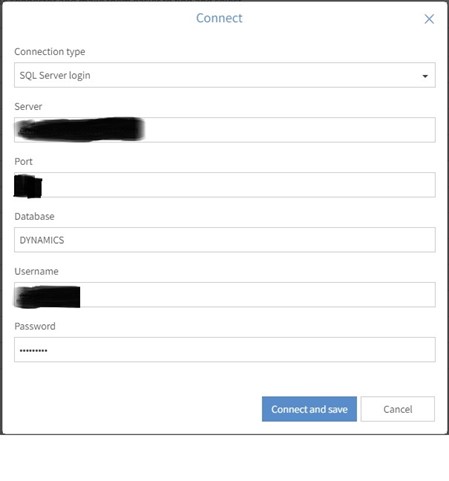
From that menu, select Connectors. The first step is to select or configure the connection to your data source. Fortunately for me, we already have many Popdock reports built, and Matrix reports uses the exact same connection we use for all other reports. I was able to select our GP connector from the list.
On the left-hand menu for that connector, select Lists. There are two sections on this screen for each connector: Lists (regular out of the box lists) and Custom Lists (if you have many regular lists you will need to scroll down the page to find Custom Lists).


To build a new list you select ‘add custom list’. You are presented with all the types of custom reports you can build. From this list, select Matrix.
The first screen is easy, as it simply asks you to give your report a name. Be sure to name your new report something meaningful. I was in a rush and did not give it much thought, calling my report “Martin MTD” (not recommended). Note: you can change the name of the report at any time.
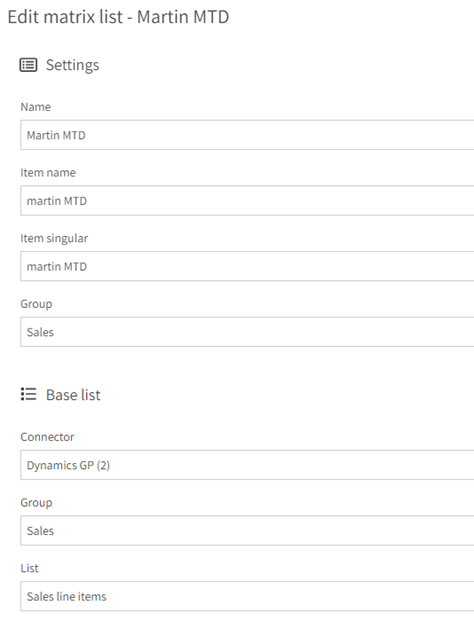
The important items on this screen are to select the group you want the list displayed under, and to choose the base list that you will be working with. In my case, I want product sales information. Therefore, I selected the Sales Line Items list.
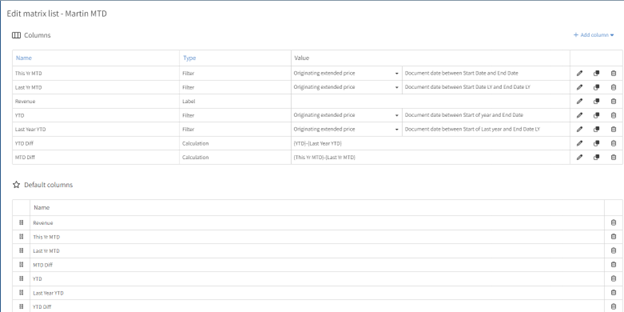
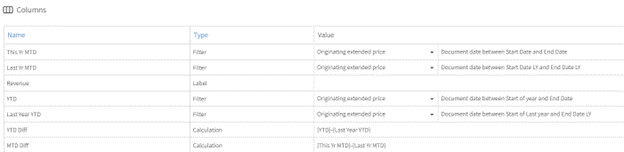
Now, it’s time to dig into building my report. Step one is to define the columns that I want to use in the report. The screenshot below is of my final column setup.

Initially, I only added one column, and I called it “This YR MTD” (This Year, Month-to-Date). I selected the type of filter column, as I knew that I would eventually be applying date filters to the data in this column. At this stage, I did not enter anything into the filter section. In the Value field, I selected ‘Originating Extender Price’. For those that know Dynamics GP, this represents this line item’s dollar value in the currency in which it was originally processed. Be sure to add this column as a ‘default column’.
Default columns will appear on your new custom report when you run it. Columns that are not added as default can be added to display by users at run time.
The next step is to define the rows I want in this report. My first version of the report only had one column and one row. The first row I called ‘Revenue’ and made it a filter row – although initially I did not define any filters. With only one row and one column, my report was only going to return a single field. This field shows the sum of the ‘originating Extender price’ for all time and all items. That is effectively eOne revenue for as long as we’ve used GP in one field. (That was a fun number to see!)
To see my new report returning the data, I selected the Preview option on the left-hand menu, and hit refresh. This means I didn’t need to leave the report building environment to test it. To my delight, I got back the value I wanted.
The next step was to add some more rows to this report. While I wanted to see total revenue, I was also interested in some specific categories of data. I wanted to see a line for SaaS revenue, one for AEP revenue and a line for Professional Services revenue. I will later expand on this report to show me product categories that split the revenue across SmartConnect, Popdock and SmartList Builder.
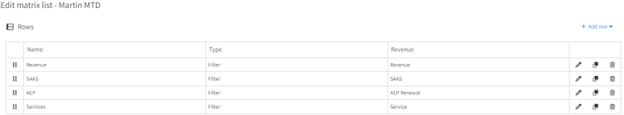
For each row, I can define a specific filter restriction. In this case, we have all our Inventory Items flagged in GP using the ‘Item Category 2’ field. Therefore, my filter for the SaaS row looked like this:
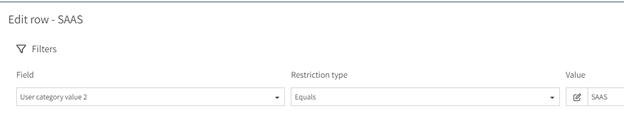
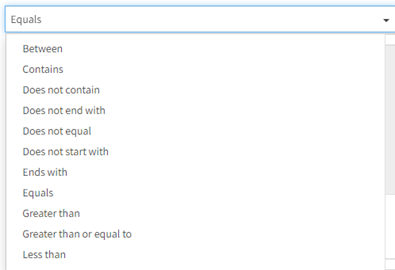
You can filter these rows on any data you choose. Your filter may not be as simple as mine and you can use any of our filter criteria. My personal favorite is the ‘one of a list’ option. This lets me freestyle any values I choose into the row category. This especially helps if your data classifications are not perfect.
After defining a filter for each row, I was able to rerun my report and the numbers looked about right. However, it was still showing data for ‘all time’ as I did not yet have any date filters on my report. Given that I wanted specific data ranges for each column, I went back to add the rest of columns.
As I was already getting adventurous, I added all the columns shown here. I was not yet sure how I was going to configure the report to pull MTD and LYMTD (Last Year, Month-to-Date) data. For the time being, I hard coded the filters to give me the data I wanted. (For example, for the MTD column I filtered where data = this month).
Then, I added a calculated column which would show the difference between the MTD and LYMTD columns. This was easy using the calculation builder. I just took one field and subtracted from another field. (This year minus last year).
I added an extra column called ‘Revenue,’ which is a ‘label field’. You will see on the final report that the first column contains the names of the rows, ‘SAAS’, ‘Services’, ‘AEP’. This column is simply giving this first column a title.
I added all these columns as default columns. You can reorder them by dragging and dropping them to where you want.
Currently, the biggest problem with this report is that my dates are hardcoded into each column. I had to start exploring how to set Variables, and to use those in my filters. The variables I defined can default automatically (as in, pull from a predefined definition like Today, Yesterday, this month, last month, this fiscal period, etc.), or they can accept a user input at the time of running the report. For each column, I needed a way to filter the report at the start date and the end date of the data.
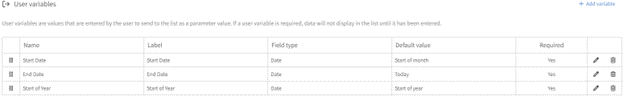
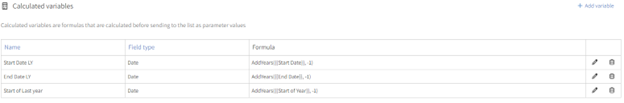
Here are the variables I created:
Start Date: When I run the report, I want it to always run for the current month (unless I tell it otherwise). I defined a variable called Start Date and set it to the beginning of the current month.
End Date: When I run the report, I want it to run up until today – so I set this variable as being ‘today’. If you are confused at this point, bear with me. By defining a variable as ‘today’ it lets me later use this to calculate today minus one year (this covers Leap Years!) to give me ‘today last year’.
Start of Year: This is the variable used when defining the start of my YTD columns.
Next, I needed to define some calculated variables to determine the start date and end date of my ‘last year’ columns.
Start Date LY: To define the start of the same month last year, I can take the variable ‘Start Date’ that was defined above and subtract one year from it. Remember that the ‘Start Date’ was the first day of this current month, so when I subtract 1 full year, I get the start date of this month last year. There is a comprehensive list of functions available to help you determine the required calculation.
End Date LY: To define the end of this same month from last year, I can take the variable I just defined above called ‘End Date’ and subtract one year.
Start of Last Year: To define last year’s start date, take this year’s start date and subtract a whole year.
Now that I have defined all the variables, I can go back to columns and use them to define the column filters. I can define a different filter (in this case date), for each column in my report.
You will notice that for this ‘YR MTD’ I chose to include any data that falls between the defined start and end dates. When I started building this report, I chose to select the relative date filter called ‘this month’. This means I can only run this report for the current month and would not be able to define a specific period for which to run the report.
For the Last Year MTD column, I used the ‘between’ filter and our two calculated variables, ‘Start of LY’ and ‘End of LY’.
Now that I have the data I need, my report is almost complete. I have a filter on each row to define the revenue type as well as a filter on each column to restrict the data range. To ensure I am getting accurate data, the final thing I need to define is global filters. By using the report level restriction, I can filter things like ‘only pull posted invoices’ or ‘ignore voided documents.’

Thank you for hanging with me as I outlined the process of writing my first report. Although this took me around 2 hours, I am confident I could rebuild it in about 20 minutes. The result looks simple, but it is a relatively complex report that I can run anytime for any date range. Matrix reporting is a total game changer for Popdock. While I love Popdock’s list reporting, I would have had to run 4 different reports or dump data into Excel and format my report. The problem with Excel is that the moment the data is exported, it is no longer reliable because it can be changed and edited. Popdock is always live, and ensures no one, not even me, can mess with the data in my report.
This report is now a standard tab that Popdock allows me to run every time I want to check how eOne is doing throughout the year. It takes about 20 seconds to run, and it has become a daily routine!
My challenge for you is to get creative and start building cool reports with Popdock.
If you have any other questions about matrix reporting with Popdock, contact one of our Popdock experts today at sales@eonesolutions.com or 888-319-3663 ext. 1.