Matrix reports offer a more in depth analysis of your data, allowing you to summarize data in columns as they relate to the rows. These reports provide the option of doing analysis comparisons of your data, such as Month to Date, Year to Date, or Year over Year. In this article, we will dive in on how to create a Monthly Sales by Customer report using the Matrix custom list option within Popdock.
Creating a Monthly Sales by Customer Matrix Report:
1. Click on the triple bar menu in the upper left corner of the Popdock homepage, and then click on Connectors from the drop down menu.

2. Locate the connector you would like to create your Matrix Report under. In this example, I am using my Dynamics 365 Business Central (Production) connector. Click on the Pencil icon (Edit) to the right of the connector you select.

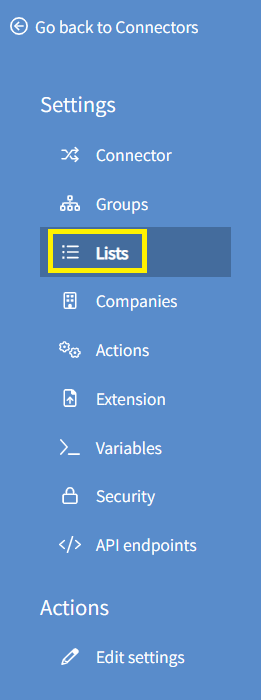
3. In the left settings menu, click on Lists.
4. Scroll to the bottom of the page to the Custom lists section. To create a new custom list, click + Add custom list.

5. In the drop down menu, select Matrix.

6. Use the Name field to give your list a name, then press Tab. The Item name, Item singular, and Group fields will populate. Adjust the Item name and Item singular as needed, and then select a Group from the drop down menu.

7. Scroll down to the Base list section. Use the available drop down menus to select which list from which connector will act as the Base list for your Matrix Report. In this example, I will be using the Sales Lines list coming from my Dynamics 365 Business Central connector.

8. Select Columns in the left Settings menu.

9. Next, I will select Generate columns. By selecting this option, I am able to generate a set of columns based on a field. In my case, I will use a date field to generate a column for each month within the year.

10. In the Column field, select a field. I will be selecting Document date.

11. Use the Start date and End date fields to adjust the dates to coincide with the Start and End of the Year.

12.The Date format field dictates how the columns will be broken out within the date range. I will select Month from the drop down menu.

13. Using the Summary method and Value field drop down menus, I will select the value field within each column I want summarized. I can also select the box next to +Add summary column to generate a column that summarizes each individual column. In this example, I will select Sum as the Summary method and Amount as the Value field. Additionally, I will also add a summary column and give it the name Total. This will sum together all values across each column for each row.

14. Click Add to generate the columns based off the specifications.

15. A list of columns will now display, one for every month and a total column. Notice that each Month column is filtered for the days that make up the month, which will summarize the Amount that falls within each bucket.

16. Click +Add column once again.

17. From the drop down menu, select Label.

18. Use the Name field to give your label column a name. In this example, we will give the name Customer. We will use this label column next when we generate our rows. Once you have given your label column a name, click Save.

19. We will next set our Rows. Click on Rows in the left Settings menu.

20. Select Dynamic row.

21. Give your row a name using the Name field and using the Field drop down menu select which field from the base list will be used to generate the rows. In this example, I will give the name Customer and select Sell to customer number from the drop down menu.

22. Under the Labels section, use the + Insert field drop down to select which fields you want used in each label for every customer. I have chosen both the Sell to customer number and Sell to customer name. Both fields will display for each customer in every row.

23. Click Add to generate these rows.

24. The newly created row will be listed.

25. With our columns and rows in place, we still set a restriction on our base list. Click Restrictions on the left settings menu.

26. Under Base list restrictions, select the Click here to add a restriction link.

27. In the Add base list restriction window, use the available Field, Restriction type, From value, and To value fields to set the restriction of Document date is between Start of year and End of year.

28. With the base list restriction fields complete, click Add.

29. The resulting Base list restriction will be displayed.

30. With our columns, rows, and base restriction in place, our list is now ready to be used. Navigate back to the Popdock homepage and click Add new tab to populate this list.

If you have questions on how to create a Matrix List, contact support@eonesolutions.com.